Authors:
Paper:
https://arxiv.org/abs/2408.10572
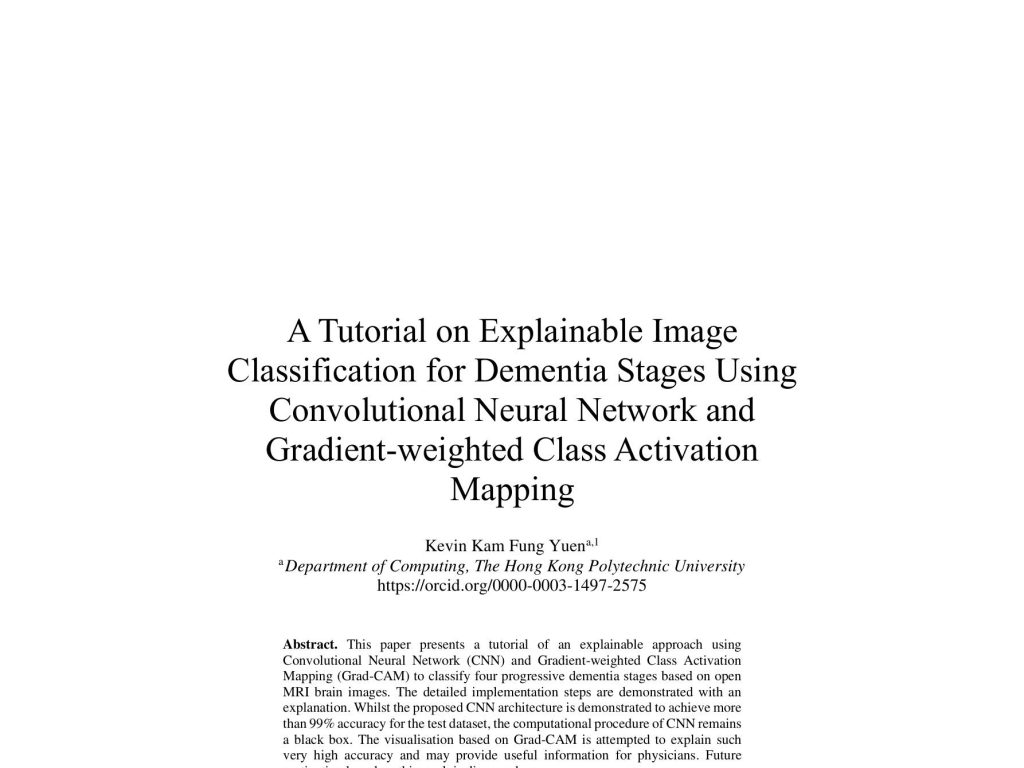
Explainable Image Classification for Dementia Stages Using CNN and Grad-CAM
Introduction
Dementia is a debilitating condition characterized by a decline in memory, language, problem-solving, and other cognitive abilities. Alzheimer’s disease is the most common form of dementia, accounting for 60-80% of cases. The progression of dementia is typically categorized into three stages: early (mild), middle (moderate), and late (severe). Accurate classification of these stages is crucial for effective treatment and management.
This blog post delves into a study that employs Convolutional Neural Networks (CNN) and Gradient-weighted Class Activation Mapping (Grad-CAM) to classify dementia stages using MRI brain images. The study aims to provide an explainable AI approach to assist physicians in understanding the model’s high accuracy and decision-making process.
Related Work
Deep learning, particularly CNNs, has revolutionized image processing tasks. The first practical application of neural networks was demonstrated by Yann LeCun in 1989 for handwritten digit classification. Since then, CNNs have been widely used in medical imaging for tasks such as brain tumor segmentation and Alzheimer’s disease diagnosis.
Several studies have applied deep learning techniques to medical images:
– Menze et al. reported on brain tumor image segmentation using various algorithms.
– Kamal et al. analyzed Alzheimer’s patients using image and gene expression data.
– Bae et al. used CNNs on T1-weighted MRI images to identify Alzheimer’s disease.
– Qiu et al. presented multimodal deep learning for assessing Alzheimer’s disease.
– Marmolejo-Saucedo and Kose applied Grad-CAM for brain tumor diagnosis.
Research Methodology
Data Exploration and Manipulation
The dataset used in this study comprises pre-processed MRI images of 128×128 pixels, categorized into four classes: non-dementia, very mild dementia, mild dementia, and moderate dementia. The dataset is imbalanced, with the moderate dementia group constituting only 1% of the total instances. Despite this imbalance, the proposed CNN method effectively handles the classification task without additional sampling techniques.
The dataset is split into training (80%), validation (10%), and test (10%) subsets. The distribution of the four stages in each subset is shown in the following pie charts:

Convolutional Neural Network
Slim CNN Structure
The proposed CNN model consists of nine layers: one input layer, three Conv2D layers, two MaxPooling2D layers, one Flatten layer, one hidden Dense layer, and one output Dense layer. This slim structure achieves over 99% accuracy for the given dataset.
The CNN layers and their parameters are explained with examples. For instance, the Conv2D layer performs convolution operations using a filter kernel, and the MaxPooling2D layer reduces the spatial dimensions of the feature maps.

Input/Output Shapes and Parameters
The CNN model has a total of 52,268,036 trainable parameters. The input layer accepts images of shape (128, 128, 1), and the output layer produces predictions for four classes. The detailed calculations for the parameters of each layer are provided to help configure the right hyper-parameters.
Experimental Design
Gradient-weighted Class Activation Mapping (Grad-CAM)
Grad-CAM is a technique for visualizing the important regions in an image that contribute to the model’s predictions. It applies the gradients of a target concept to the final convolutional layer to produce a coarse localization map.
The implementation of Grad-CAM for the proposed CNN model involves three algorithms:
1. Grad-CAM Heatmap Algorithm: Computes the heatmap based on the gradients of the top predicted class.
2. Grad-CAM Display Algorithm: Converts the image file into an array, preprocesses it, and generates the heatmap.
3. Grad-CAM Explainability Plot Algorithm: Plots the original image, grey heatmap, jet heatmap, and prediction images.

Results and Analysis
Training and Validation
The CNN model was trained using 5119 images, validated with 639 images, and tested with 642 images. The training process took approximately 1.81 hours, and the accuracy and loss metrics converged after 10 epochs. The training accuracy reached 100%, while the validation accuracy was 98.28%.

Confusion Matrix and Classification Metrics
The confusion matrix for the test dataset shows that only two instances were misclassified, resulting in an accuracy of 99.69%. The precision, recall, and F1-score values are close to 100%, indicating an almost perfect solution.

Grad-CAM Visualizations
Grad-CAM visualizations provide insights into the model’s decision-making process. The heatmaps highlight the important regions in the MRI images that contribute to the predictions. Examples of correct and incorrect classifications are shown below:
Correct Classification:

Incorrect Classification:

Overall Conclusion
This study presents a slim CNN structure that achieves over 99% accuracy in classifying dementia stages using MRI images. The Grad-CAM technique is employed to visualize the important regions in the images, providing an explainable AI approach. While the CNN model demonstrates excellent performance, further validation from medical practitioners is needed to interpret the Grad-CAM visualizations.
Future work may explore different CNN structures and explainable visualization methods to enhance the understanding and applicability of deep learning models in medical imaging.
The source code for this study is available on the author’s GitHub: GitHub Repository.

